Continuing from the previous post, today i'll write: how to check a webpage's speed and performance.
Here you can check how is your web page loads and performs.
Giving you detail of all the Parameters which are vital in page’s performance, not only that it remember your past performances and therefore able to give you a comparative analysis. And from there you will get a look on how is you page performing from the past to present.
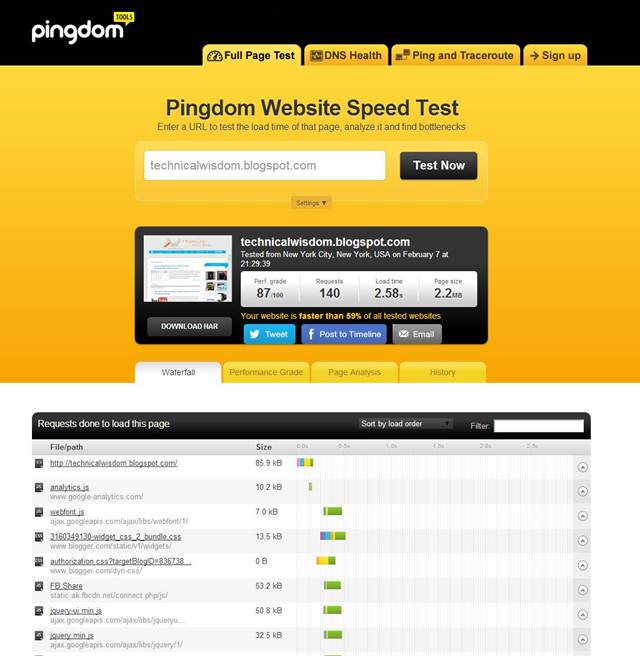
i) You will get a list of all the elements under the first tab(waterfall), and with their loading time indicated with colorful bar. Also they provide a Little summary of page's test on this tab on top, Assigning a Performance Grade and Percentage comparison with other website before tested ( like: Your website is faster than 73% of all tested websites) and the location Where it tested.

ii) Second Tab(Performance) consists of considering the webpage with other additional factors, and grading them acconrdingly.
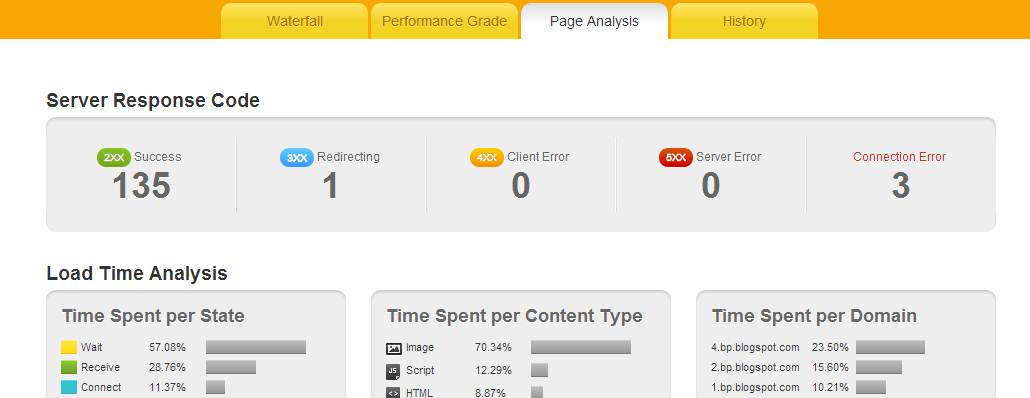
iii) Third Tab(Page Analysis) this picture tells us everything, i don't think there is anything more needed to tell! only to say that it has two more section

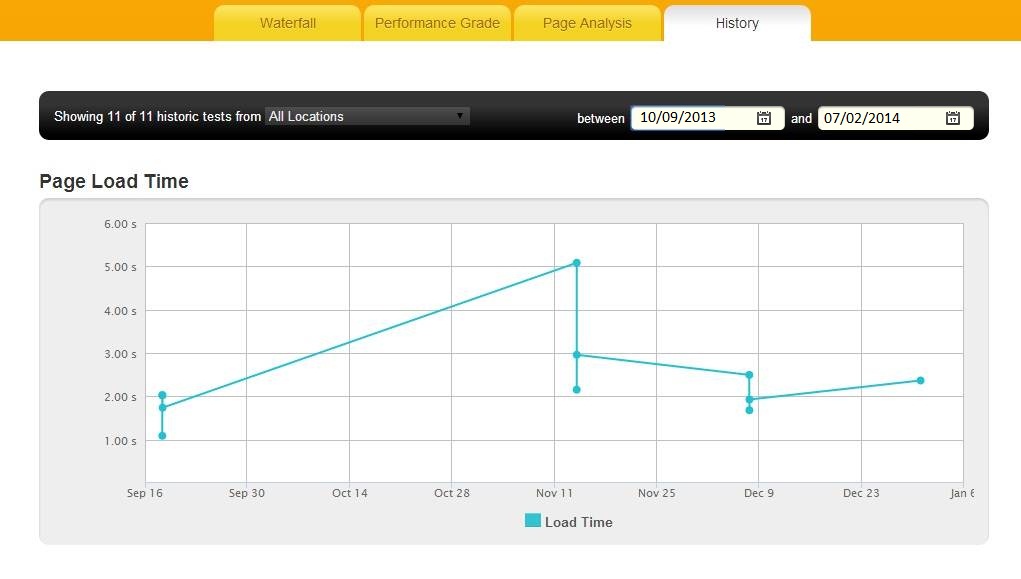
iii) Forth Tab(History) Here you will get graphs of three parameters for all the dates when you have tested your site.

nibbler is another good webtool like pingdom.
Pingdom
tool(Website Speed Test)
just open the link: http://tools.pingdom.com/fpt/ Here you can check how is your web page loads and performs.
Giving you detail of all the Parameters which are vital in page’s performance, not only that it remember your past performances and therefore able to give you a comparative analysis. And from there you will get a look on how is you page performing from the past to present.

ii) Second Tab(Performance) consists of considering the webpage with other additional factors, and grading them acconrdingly.
iii) Third Tab(Page Analysis) this picture tells us everything, i don't think there is anything more needed to tell! only to say that it has two more section
Size Analysis
Request Analysis along with the two that you can see in picture, i.e
Server Response Code
Load Time Analysis

iii) Forth Tab(History) Here you will get graphs of three parameters for all the dates when you have tested your site.
Page Load Time
Page Size and Request Count,
Page Speed Score


No comments:
Be the First to Comment ↓